What is changing
Modern applications can emit an extraordinary amount of telemetry. Logs, metrics, traces, profiles, and product events describe the same system from different angles, but collecting all of them does not guarantee that an engineer can explain a failure.
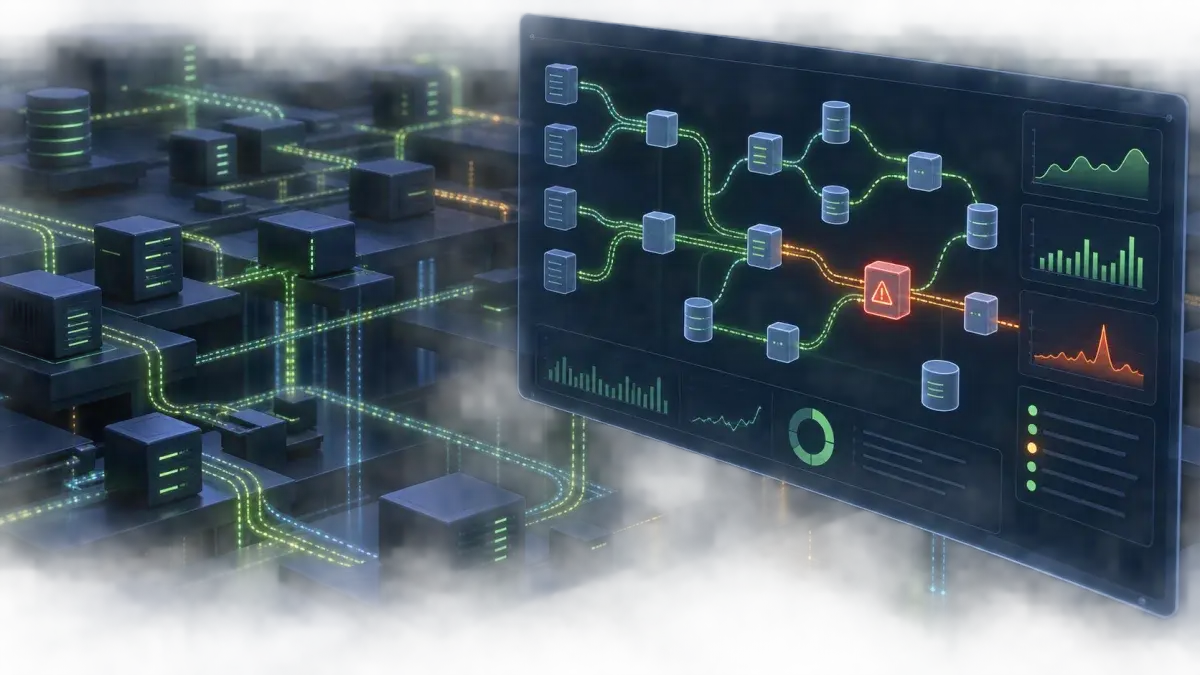
The hard part is preserving the relationships between those signals. A slow request matters because of the user action it interrupted, the release that introduced it, and the downstream service that amplified it.
Why it matters
Dashboards often optimize for what is easy to count. CPU use and error totals are useful, but they become actionable only when a team can connect them to a journey, customer, or business operation.
Context also shortens incident response. Engineers make better decisions when an alert includes ownership, recent changes, dependencies, and a representative trace. Without that structure, every incident begins with a search for the system's basic shape.
The signal
Observability is moving from data accumulation toward explanation. The best systems help teams ask a question, follow evidence across boundaries, and understand the effect of a technical change without learning a new query language first.
That shift rewards deliberate instrumentation. A smaller set of connected, trustworthy signals can reveal more than a large archive of telemetry that nobody can confidently interpret.